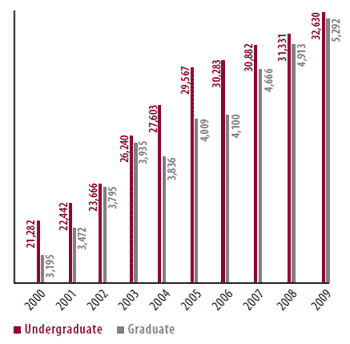
Enrollment (Fall 2009)
| Head count | % | |
| Undergraduate students | 32,630 | 86.0 |
| Female | 19,844 | 60.8 |
| Male | 12,786 | 39.2 |
| Graduate students | 5,292 | 14.0 |
| Female | 3,031 | 57.3 |
| Male | 2,261 | 42.7 |
| International students | 1,929 | 5.1 |
| Students away on exchanges (2009-2010) | 417 | 1.1 |
| Language used | ||
| English | 26,304 | 69.4 |
| French | 11,618 | 30.6 |
By Faculty
| Undergraduate | Graduate | Total | % | |
| Arts | 6,624 | 826 | 7,450 | 19.6 |
| Education | 1,612 | 607 | 2,219 | 5.8 |
| Engineering | 1,979 | 671 | 2,650 | 7.0 |
| Health Sciences | 3,926 | 547 | 4,473 | 11.8 |
| Law | 1,786 | 132 | 1,918 | 5.1 |
| Management (Telfer) | 3,451 | 288 | 3,739 | 9.9 |
| Medicine | 1,819 | 508 | 2,327 | 6.1 |
| Science | 3,512 | 440 | 3,952 | 10.4 |
| Social Sciences | 7,921 | 1,137 | 9,058 | 23.9 |
| Interdisciplinary Graduate Studies | 136 | 136 | 0.4 | |
| Total | 32,630 | 5,292 | 37,922 | 100 |
Interdisciplinary Programs
| Enrollment | Number of programs | |
| Undergraduate | 5,022 | 53 |
| Graduate | 597 | 53 |
Increasing Enrollment

